Section 1: Introduction
WilcoFlood includes (1) a geospatial representation of road segments affected by flooding, and (2) a representation of bridges with active flood warnings where water levels are approaching or exceeding the bridge’s low chord elevation.
Section 2: Disclaimer
This is a research product prepared by the University of Texas at Austin. It has not been prepared by, reviewed by, approved by, or otherwise assisted by Williamson County or any municipal entity within Williamson County. No such entity bears any responsibility for the contents, accuracy, or use of this research product.
All Data produced, collected, maintained, assembled, or otherwise gathered by the University of Texas at Austin ("UT Austin") and its research partners as part of shall be used only as necessary to support the findings and conclusions made by this project. All such Data may be subject to change and revision as additional information or new scientific analysis becomes available.
The University of Texas at Austin does not warrant the accuracy or reliability of the Data nor otherwise assume responsibility for any actions or reliance upon the Data outside the scope of this research project. All transmission and use of the Data collected, maintained, and published herein shall be the responsibility of the person, entity, or party incorporating the Data outside of this research project.
Forecasted road and bridge flooding results are estimates and subject to several limitations, including but not limited to: (1) missing or misaligned roads, bridges, or streams; (2) incomplete or outdated lidar, HAND, or National Water Model data; (3) simplified hydraulic assumptions; and (4) limited forecast range. Forecasts may not capture backwater effects, local ponding, or flash flood timing. This information is for informational purposes only and shall not be used as official guidance.
Displayed data represent the maximum predicted flood levels within the 18-hour forecast window.
Section 3: WilcoFlood.org
WilcoFlood.org is a web application developed by the University of Texas at Austin. The system provides hourly updates of flood extents within Williamson County, based on hydrologic data from the National Water Model (NWM) short-range forecast. These flood limits reflect the maximum predicted flood levels within an 18-hour forecast window.
WilcoFlood system delivers data in three formats: (1) flood inundation polygons, (2) flooded roadway segments, and (3) bridge warning points. The interface was developed to demonstrate how these continuously updated datasets can be effectively visualized.
Section 4: Road Elevation Model
The Road Elevation Model is a digital surface dataset representing roadway terrain, developed to support flood impact assessments along vehicular corridors. Created by Oak Ridge National Laboratory (ORNL) using LiDAR point cloud data, the model focuses on buffered zones around OpenStreetMap (OSM) road centerlines to capture the elevation of the actual travel surface. This dataset is essential for determining where forecasted floodwaters may intersect roads and for establishing both flood inundation polygons and flooded road discharge thresholds. Road elevation data for the entire state of Texas is available here.
Section 5: Static Layers
Before the WilcoFlood system can operate in real-time, it requires a foundation of static geospatial and tabular data to support the generation of dynamic flood warnings. These static datasets are pre-computed and staged to establish the relationships between forecasted hydrologic conditions and their geospatial impacts. This pre-processing involves (1) generating flood inundation polygons based on terrain models, stream networks, and flood thresholds, (2) identifying roadway segments and bridge locations that intersect with predicted flood extents and (3) assigning thresholds and metadata (road type, functional class, bridge elevation) to inform impact assessments.
Section 6: Flood Inundation Maps
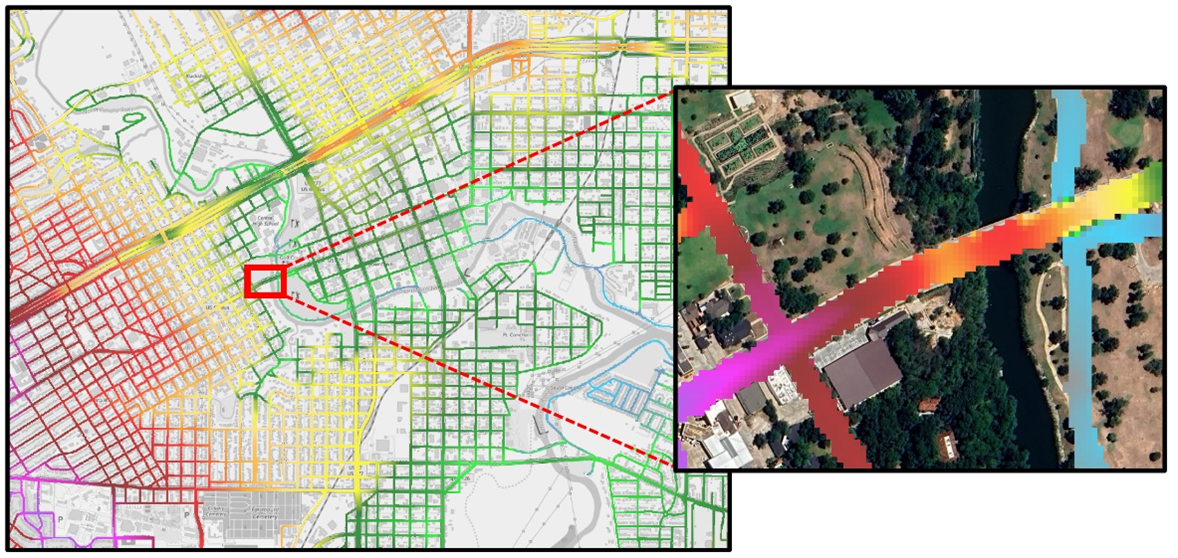
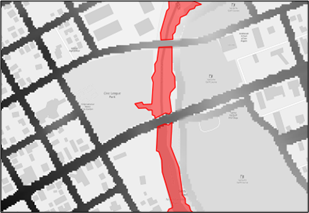
Flood inundation polygons for various flow rates along each National Water Model stream in Texas were originally generated to support the Texas Department of Emergency Management (TDEM) as part of the “Pin2Flood” project. These polygons were created at approximately 1-foot vertical intervals using the Height Above Nearest Drainage (HAND) method applied to 3-meter terrain data. For integration into the WilcoFlood system, each polygon was further refined using the road elevation model to mask out road segments that remain unflooded (i.e., not overtopped) at a given flow rate.
Section 7: Flooded Roads
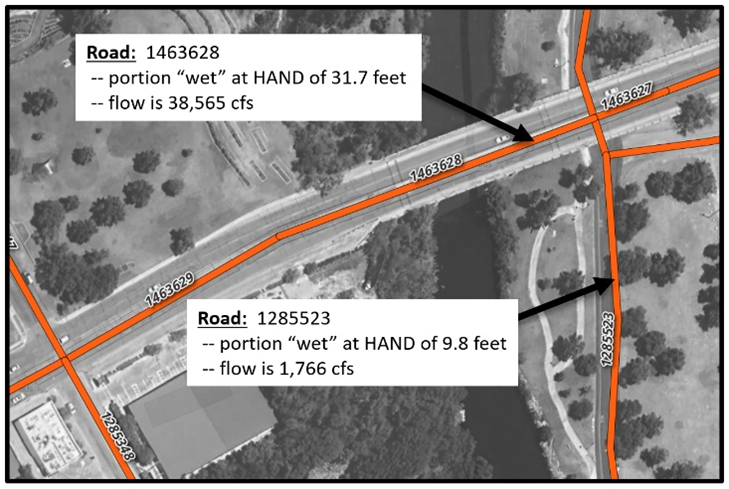
Using OpenStreetMap (OSM) road linework, the vehicular road network in Texas was divided into over 2.6 million individual segments. For each segment, a flood trigger flow value was identified representing the river flow at which that segment begins to show signs of flooding. This was determined by intersecting each road segment with precomputed flood inundation polygons, allowing the system to establish the flow threshold at which a specific road is overtopped.
Section 8: Bridge Warnings
Warning data for points for bridges that cross over a stream identified in the National Water Model (NWM) were extracted using the “TX-Bridge” methods detailed in section 5.2.1 of Technical Memorandum FY24RU1 [TMFY24RU1Project0_7095_01.pdf]
Section 9: Streamflow Forecasts
WilcoFlood converts hydrologic forecasts into actionable flood mapping products by translating predicted stream flows into spatial representations of inundation, flooded roads, and bridge hazards. The WilcoFlood system relies on one source of hydrologic forecast data: the National Water Model. The National Water Model (NWM) output file, produced by NOAA’s National Centers for Environmental Prediction (NCEP), provides forecast data in NetCDF format covering the most recent two days.
Section 10: Backend Service
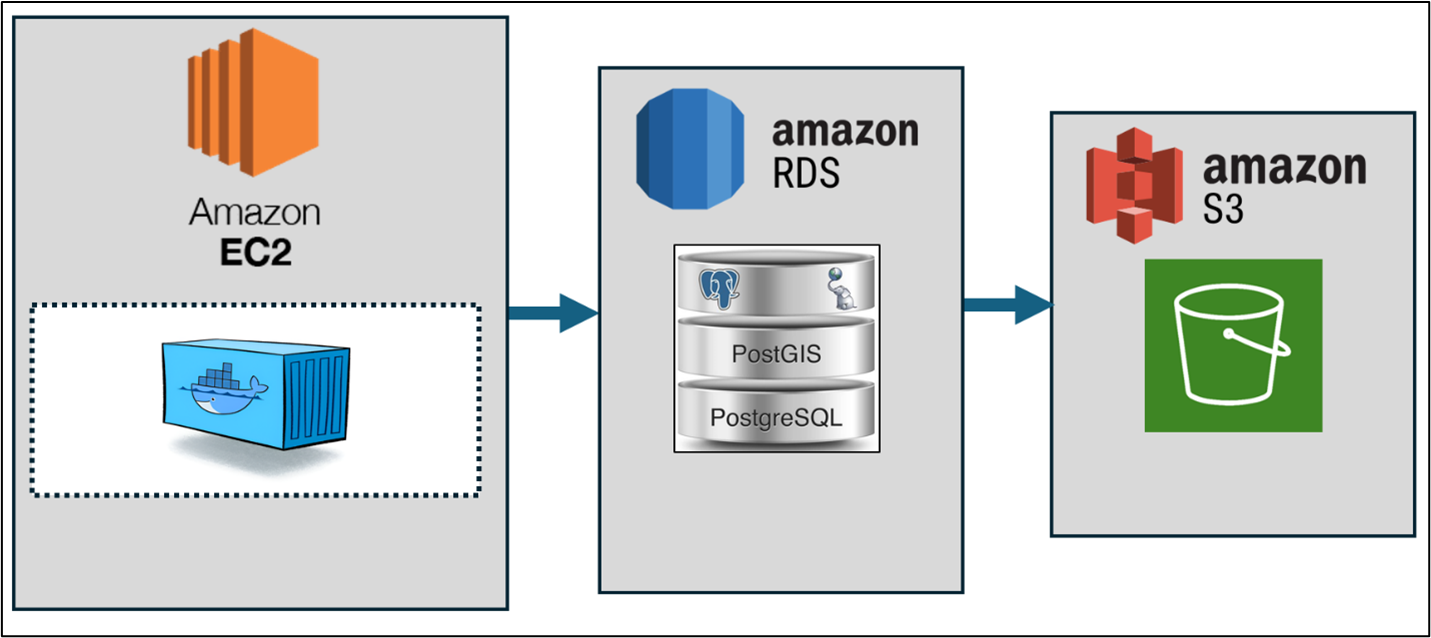
The WilcoFlood system transforms real-time hydrologic forecast data into actionable flood mapping products through an automated, cloud-based process. This system is built on Amazon Web Services (AWS) infrastructure, with several coordinated components that work together to ingest forecast data, process it against known flood thresholds, and publish updated map layers for use by downstream applications.
At the heart of the system is a Python application deployed on an Amazon EC2 instance. This EC2 machine runs a Docker container that holds the WilcoFlood application code, which is publicly available at https://github.com/andycarter-pe/fast_realtime The WilcoFlood application monitors new short-range hydrologic forecasts and, when detected, triggers a SQL script. This script performs spatial queries and calculations by connecting to a PostgreSQL/PostGIS database hosted on Amazon RDS.
The database holds static flood-related layers for each stream segment. These include flood inundation polygons, road flooding thresholds, bridge overtopping points, and rating curves. When new streamflow forecasts arrive, the SQL query compares the forecasted flows to these thresholds to determine whether flooding is likely. This process results in the generation of several “dynamic” layers: flooded road lines, active bridge warning points, and flood inundation polygons that reflect the latest hydrologic forecast.
Once generated, these spatial layers are exported from the database in GeoJSON format. The resulting files are uploaded to an Amazon S3 bucket. These files are intended for use in GIS software platforms like ArcGIS or QGIS, and are also ingested by custom web applications.
By automating this end-to-end workflow, the system provides near real-time flood risk information with minimal manual intervention. It allows Williamson County to access location-specific flood impact data as hydrologic conditions evolve.
The WilcoFlood system’s data infrastructure is built using PostgreSQL, an open-source relational database, enhanced with PostGIS to support spatial queries and geographic data types. PostgreSQL database dump for Williamson County is publicly available here The database for the WilcoFlood system is about 230 Mb.